Weekly Overview
This page is the weekly operating snapshot for the collections portfolio. Use the project navigator on the left to jump between initiatives, then review each section for the key message, supporting evidence, and the charts that matter this week.
Reporting Window
Apr 6 - 12, 2026
The dashboard summarizes the latest completed weekly reporting period.
Projects Covered
3
Both automated notebook projects and manual status updates are included in one portfolio view.
In Progress
3
These initiatives currently need active monitoring, iteration, or coordination work.
Finished
0
Completed initiatives stay visible so the weekly record remains consistent over time.
MAB
MAB WhatsApp Optimization
Improve payment response versus a fixed notification strategy
In progress
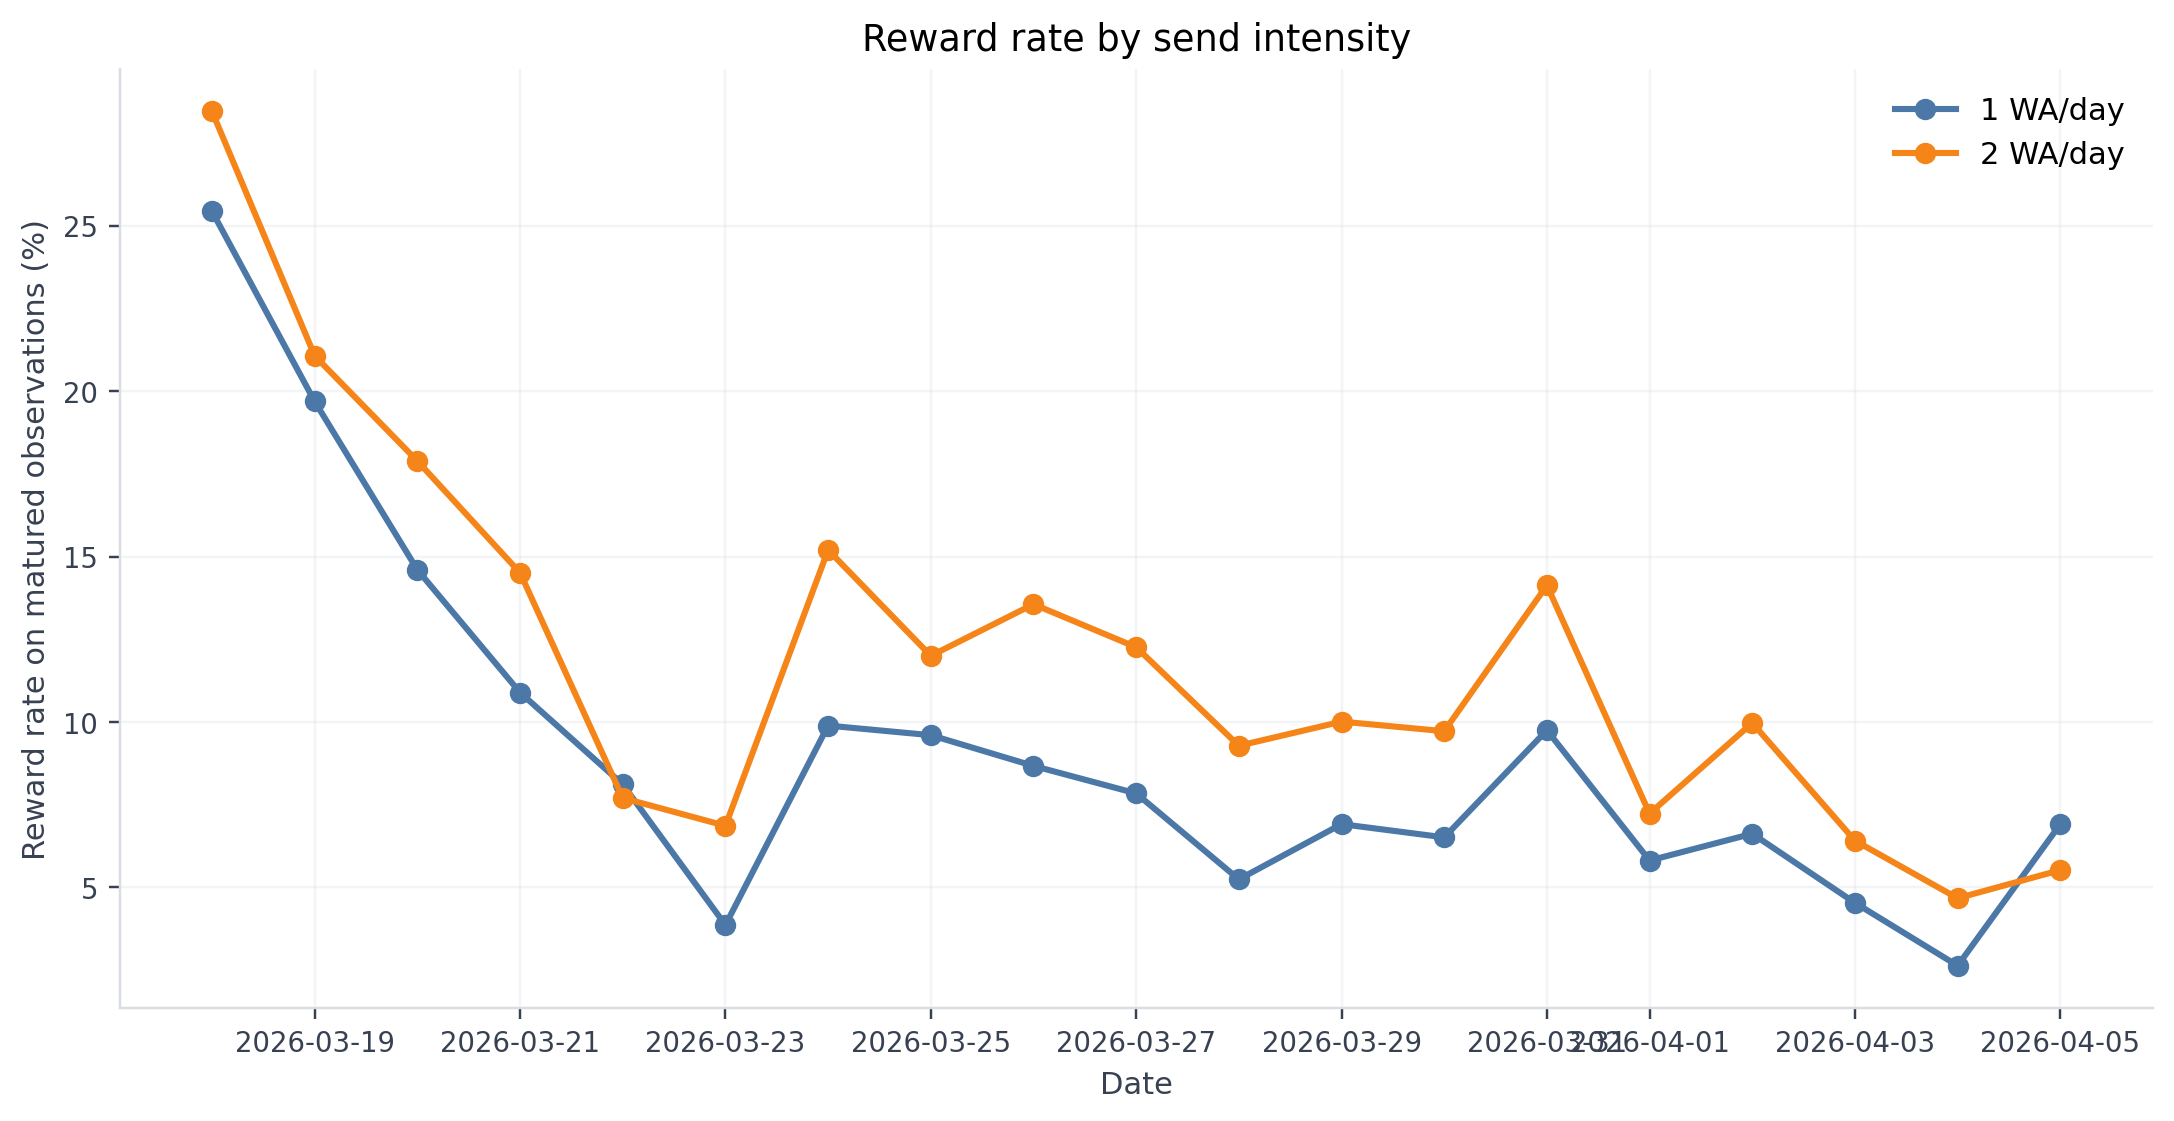
Last week reward rate
6.8%
Full duration reward rate
9.6%
Last week recovered
$2,946,259
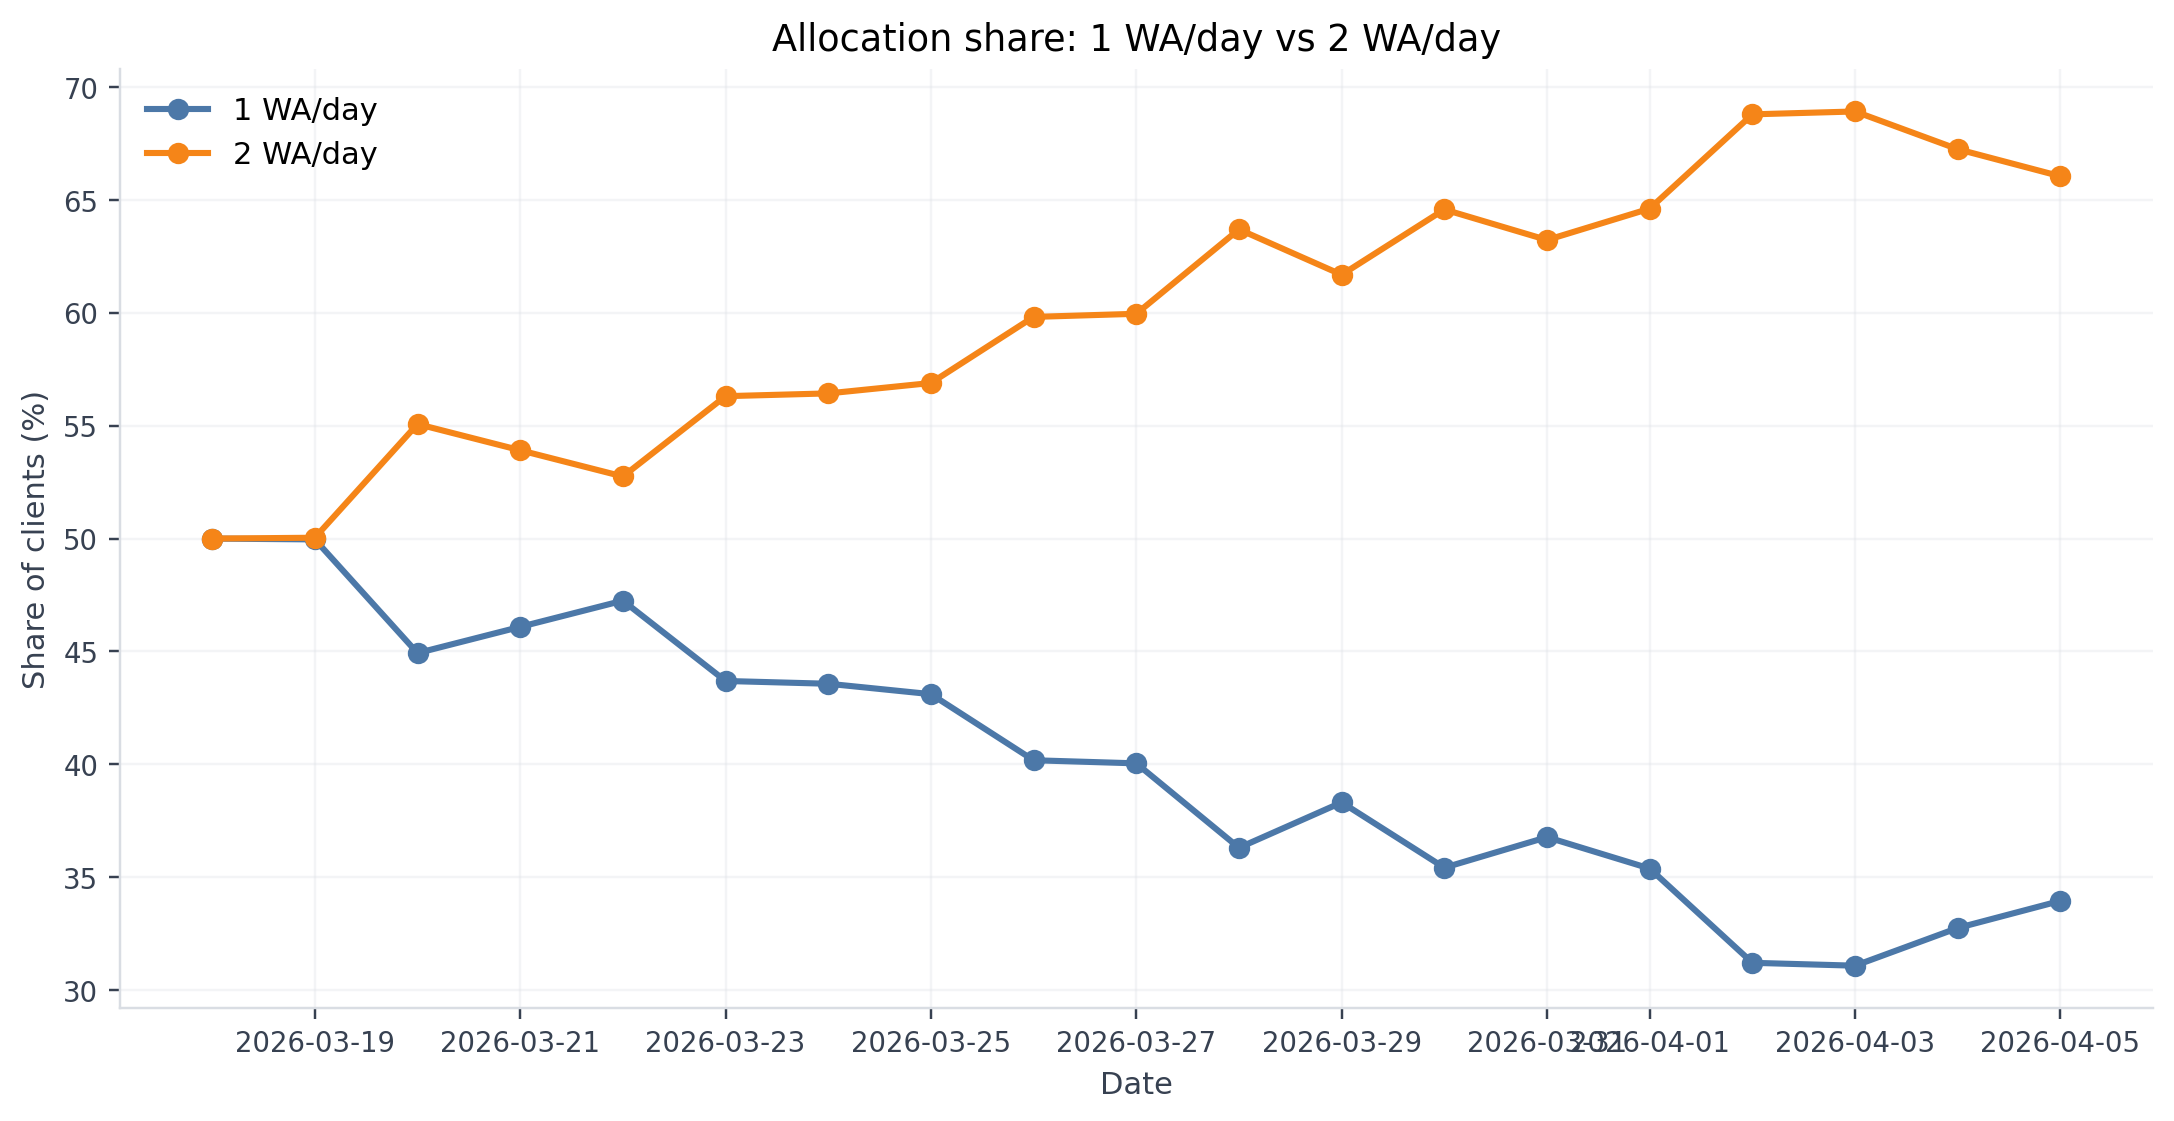
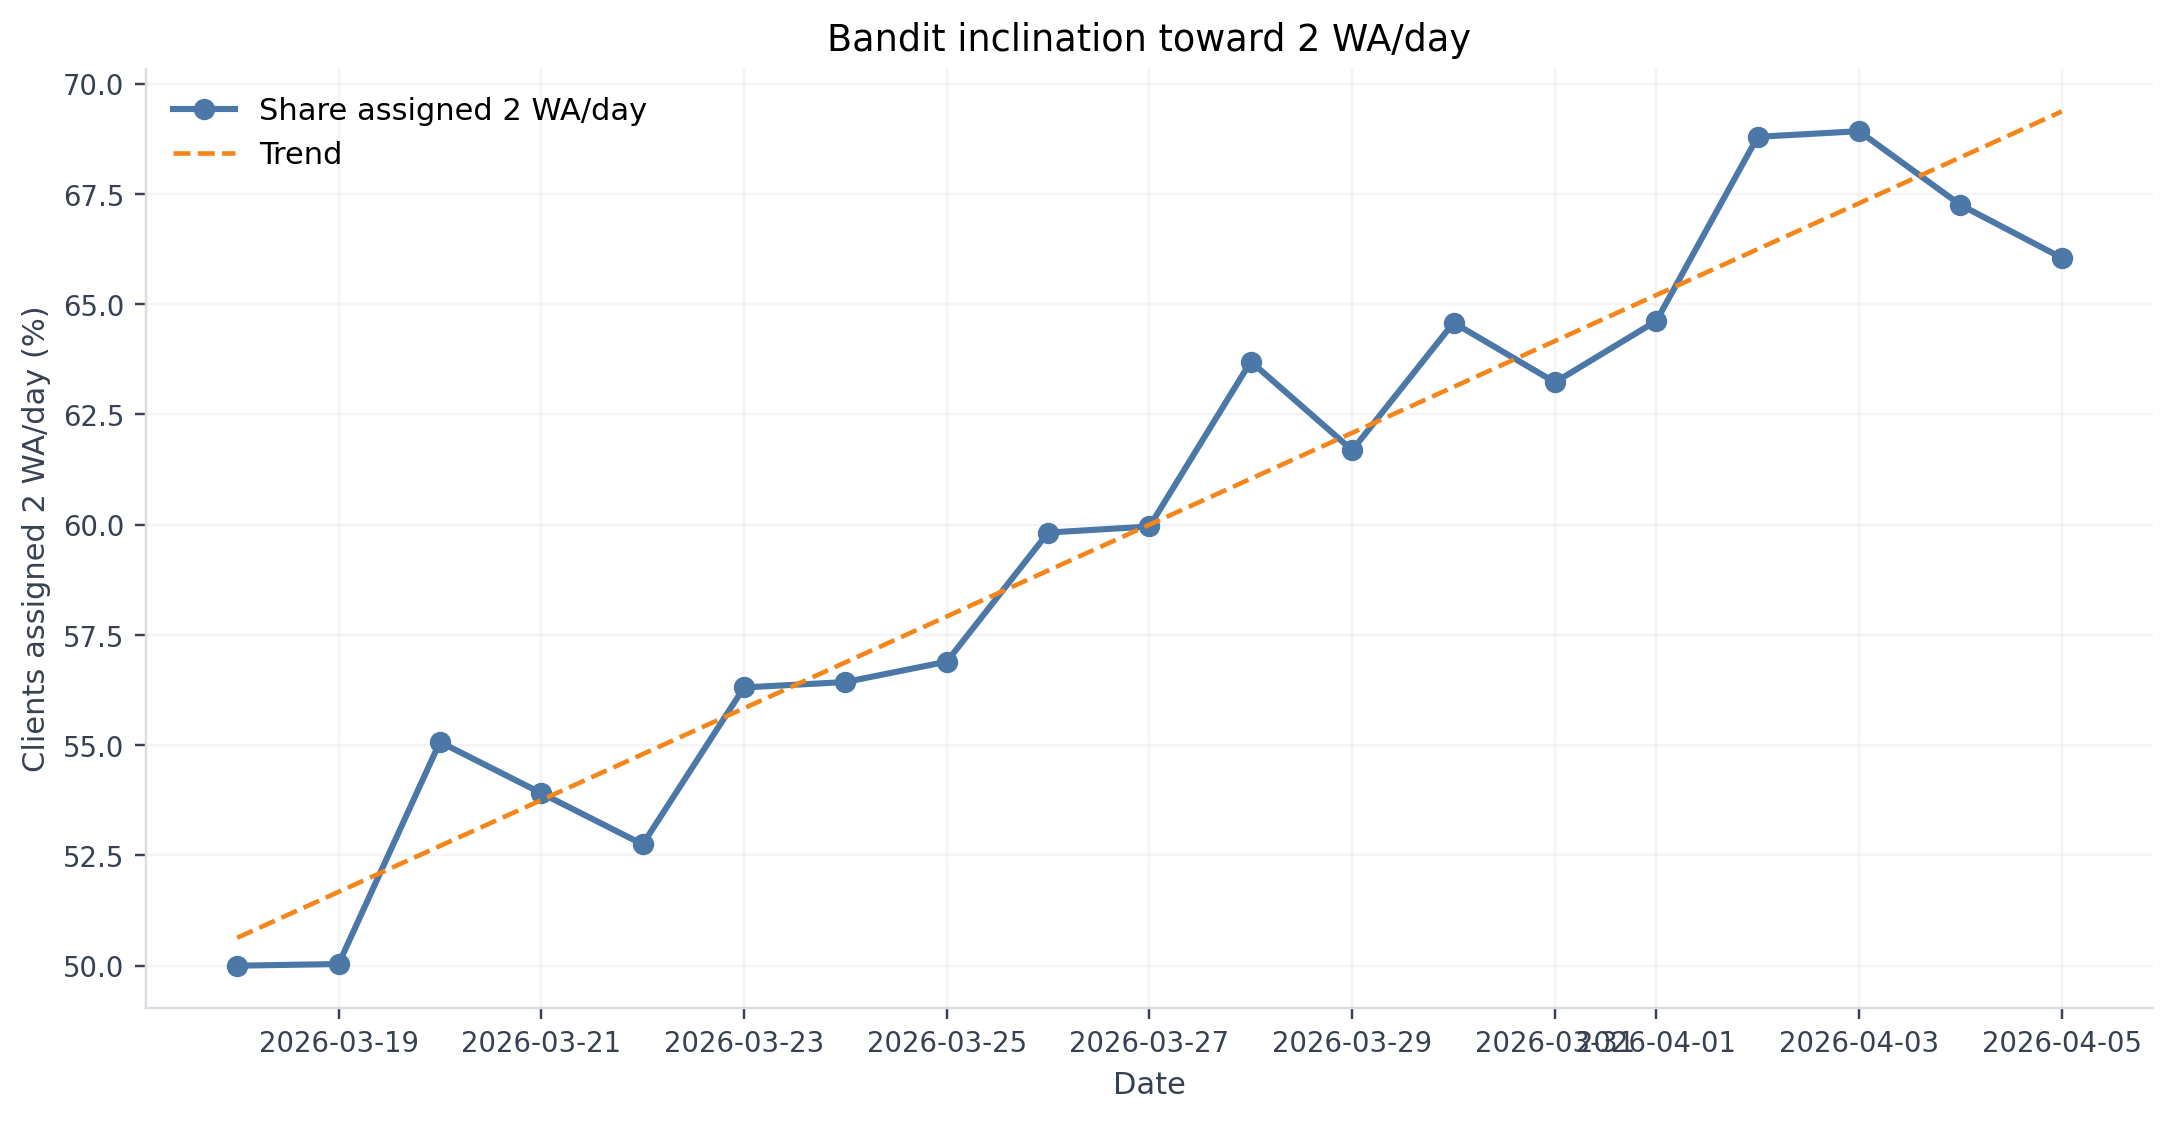
K=2 exit share
66.0%
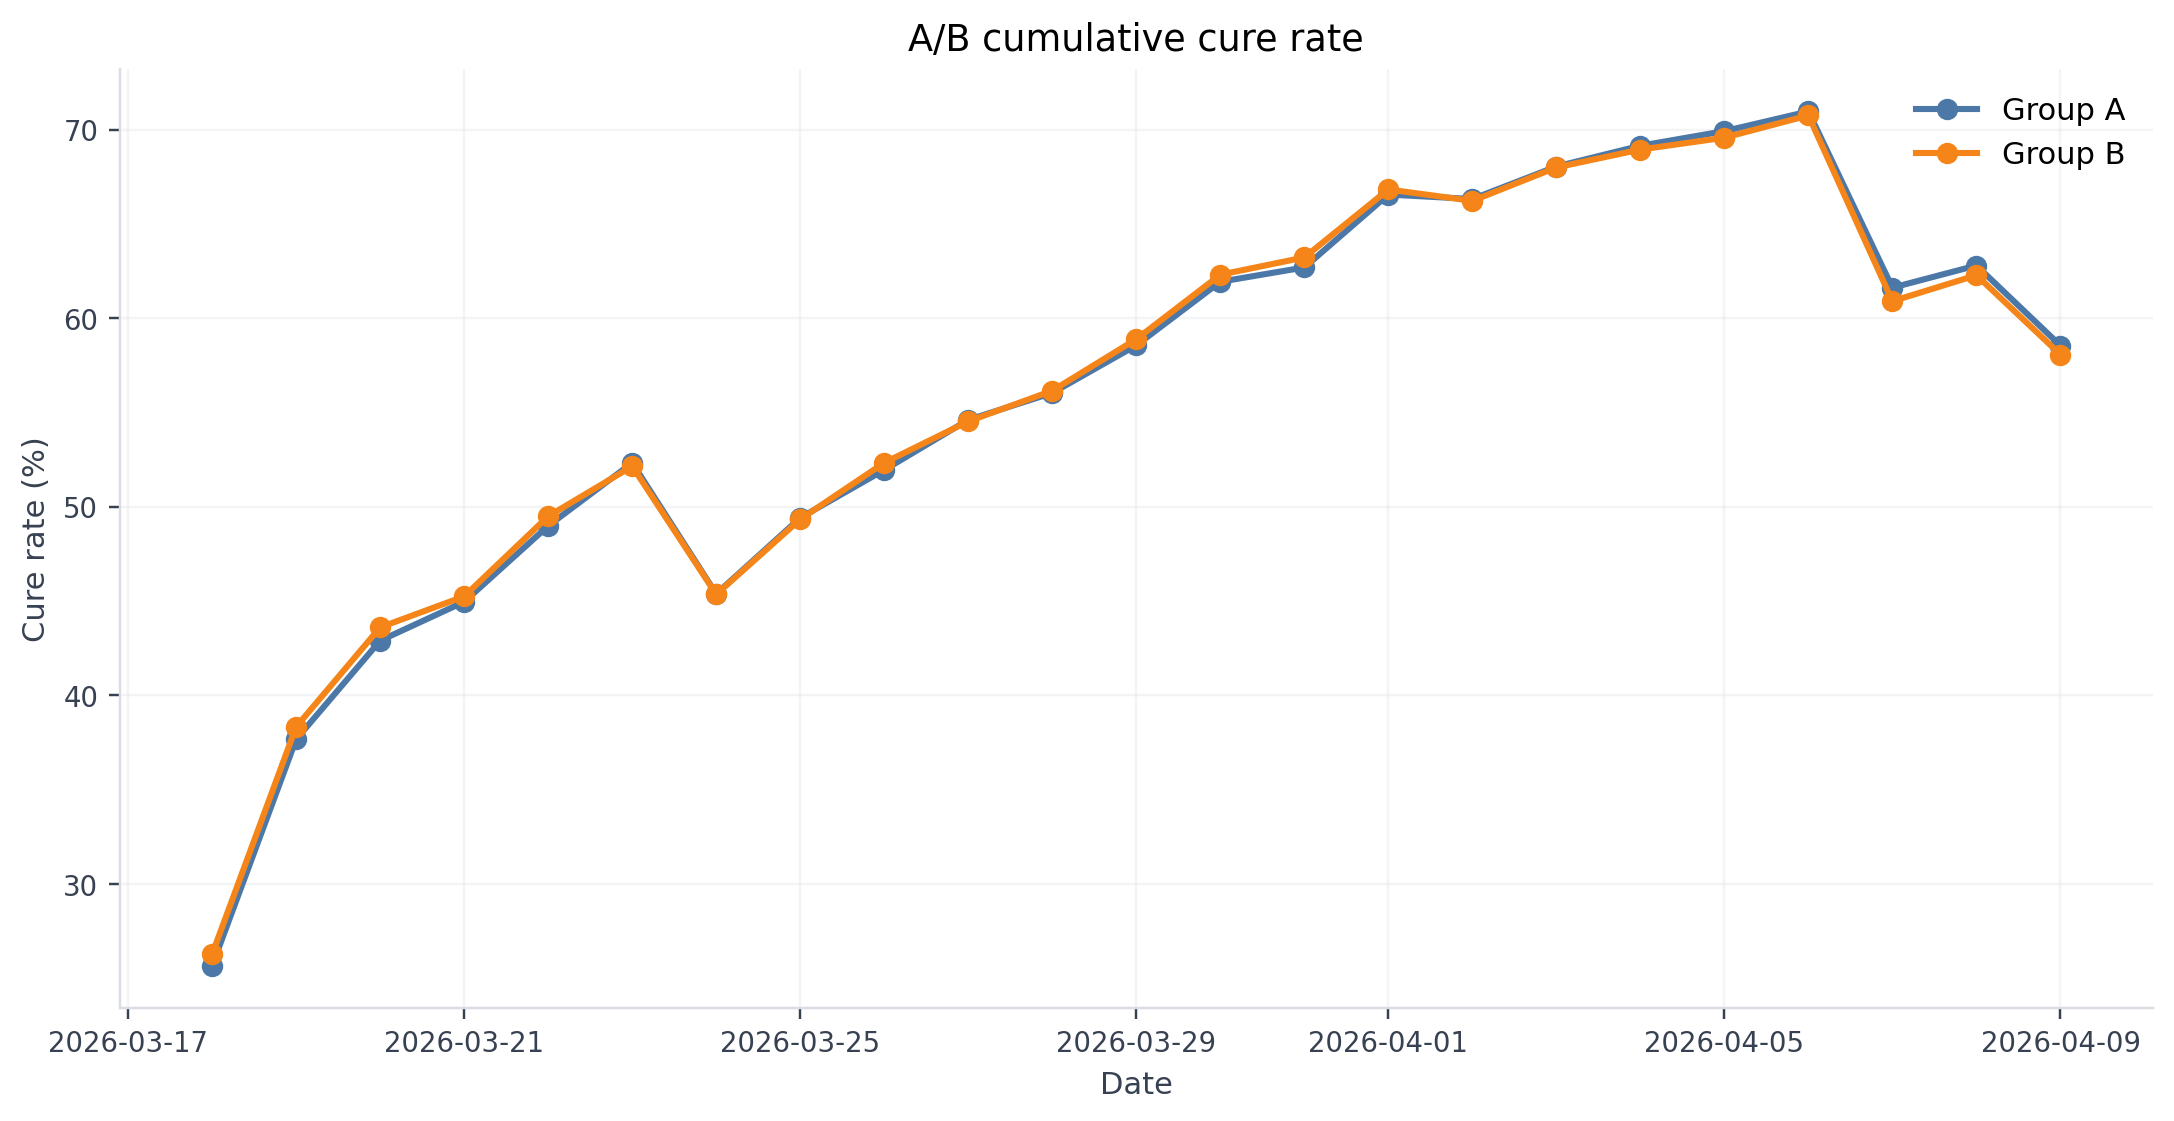
Full Duration Snapshot
2026-03-18 to 2026-04-05
| Group | Clients | Cure rate | Recovered |
|---|---|---|---|
| A | 18,164 | 58.6% | $11,374,043 |
| B | 18,177 | 58.1% | $10,989,732 |
B - A: -0.48 pp
· p=0.357 · not statistically significant
Last Week Snapshot
2026-03-30 to 2026-04-05
| Group | Clients | Cure rate | Recovered |
|---|---|---|---|
| A | 5,830 | 38.7% | $2,493,552 |
| B | 5,803 | 37.6% | $2,452,132 |
Key Takeaways
- Weekly vs full duration: reward rate 6.8% vs 9.6%; recovered $2,946,259 vs $11,230,462.
- Intensity shift: k=2 moved 64.6% -> 66.0% last week.
- Event layer still looks diffuse because learning is split across many small segment-hour cells, not one global event pool.
FIELD VISITS
Field Visits - Kobra
Improve recovery in selected overdue segments through visits
In progress
Visits
359
Accounts visited
355
Access rate
62.1%
PTP amount
$31,047
Full Duration Snapshot
2026-03-01 to 2026-04-05
| Group | Clients | Cure rate | Recovered |
|---|---|---|---|
| A | 1,783 | 7.9% | $765,267 |
| K | 1,780 | 10.7% | $974,231 |
K - A: +2.82 pp
· p=0.004 · statistically significant
Last Week Snapshot
2026-03-30 to 2026-04-05
| Group | Clients | Cure rate | Recovered |
|---|---|---|---|
| A | 1,691 | 2.2% | $199,625 |
| K | 1,673 | 3.8% | $294,170 |
Key Takeaways
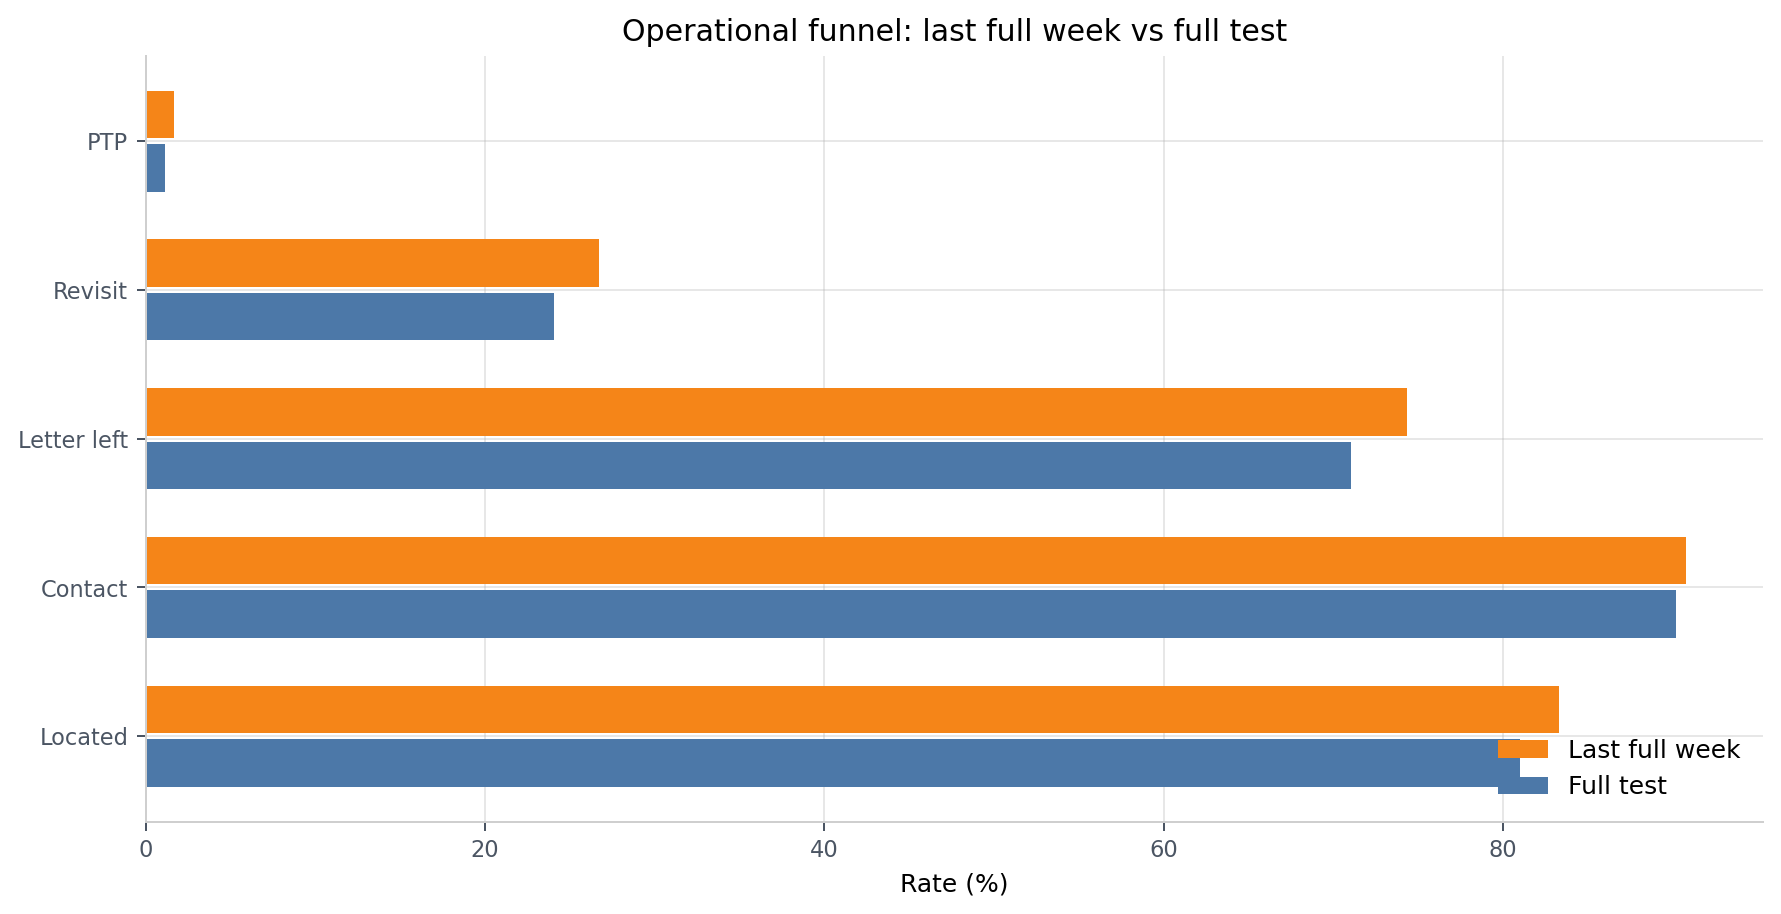
- Weekly execution: 359 visits, 355 accounts, 22 agents, 3 states.
- Weekly vs full duration: located 83.3% vs 81.0%, access 62.1% vs 57.7%.
- Business signal: PTP 6 for $31,047; K weekly cure 3.8% vs A 2.2%.
AI IN COLLECTIONS
AI in Collections
In progress
Description
This project is a process of trial and error on how to improve collections processes with the help of AI agents, LLM skills, etc.
Key Takeaways
- Started collecting recurring business use cases from stakeholders
- Started gathering business context for AI use cases
- Automated the weekly updates build process